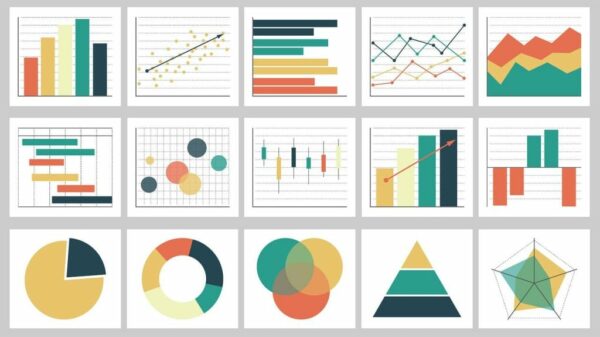
Data visualization is the process of transforming raw data into visual representations that help users understand and analyze information. It is a powerful tool that can be used to communicate complex ideas in a clear and concise way. However, data visualization can be expensive. There are a number of factors that contribute to the cost of data visualization, including:
- The cost of data collection and preparation. Before any data can be visualized, it must first be collected and prepared. This can be a time-consuming and expensive process, especially if the data is large or complex.
- The cost of software. There are a number of software programs available for data visualization. These programs can range in price from free to thousands of dollars. The cost of software will depend on the features and functionality that are required.
- The cost of expertise. Data visualization requires a high level of expertise. Data visualization professionals must have a strong understanding of data analysis, design, and communication. They must also be able to use data visualization software effectively. The cost of expertise will depend on the complexity of the project and the level of experience of the data visualization professional.
In addition to these factors, the cost of data visualization can also be affected by the following:
- The size and complexity of the data set. The larger and more complex the data set, the more time and effort will be required to collect, prepare, and visualize the data.
- The level of interactivity required. If the data visualization is to be interactive, this will add to the cost of the project. Interactive data visualizations allow users to explore the data in more depth and to drill down into specific areas of interest.
- The need for custom development. If the data visualization requirements are not met by off-the-shelf software, custom development may be required. Custom development can be expensive, but it can also provide the most flexibility and control over the final product.
Despite the cost, data visualization is a valuable tool that can be used to improve decision-making and performance. When done well, data visualization can help businesses to:
- Identify trends and patterns in data
- Make better decisions based on data
- Communicate data effectively to stakeholders
- Improve efficiency and productivity
- Increase customer satisfaction
If you are considering using data visualization, it is important to factor in the cost of the project. However, the cost of data visualization should not be a barrier to its use. Data visualization can be a valuable investment that can help businesses to improve their performance and achieve their goals.
Here are some tips for reducing the cost of data visualization:
- Use open source data visualization software. There are a number of open source data visualization software programs available that can be used for free or at a low cost.
- Collect and prepare your own data. If possible, collect and prepare your own data. This will save you the cost of hiring a data collection company.
- Use data visualization templates. There are a number of data visualization templates available that can be used to create professional-looking data visualizations.
- Get help from a data visualization professional. If you are not comfortable creating data visualizations yourself, you can hire a data visualization professional to help you.
By following these tips, you can reduce the cost of data visualization and still create effective and informative data visualizations.


